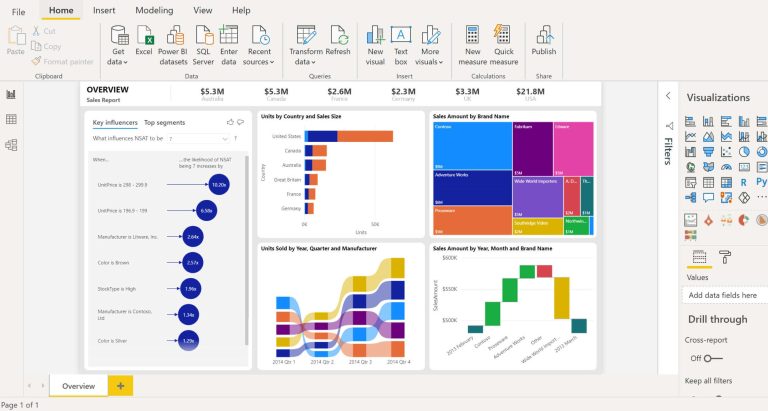
Power BI Service: Within the range of Microsoft solutions, one emerged that perfects what Excel previously generated through various add-ons: Power BI. The tool generates reports and interactive visualizations, linked to each other, with Dashboards that provide vital information for the business instantly, with dynamic updating, with the facility to drill down for greater detail of the data collected.
Power BI also allows connection to data from multiple sources simultaneously, and information modeling (data cleansing and transformation). At the same time, the possibility of asking questions in natural language (Q&A) is added to the tool so that the system quickly generates tables and graphic reports using the variables that the model has.
There are 2 versions: desktop and web, using a browser and a login/user. They are simply downloadable from the Power BI site ( https://powerbi.microsoft.com ) and can help Microsoft Dynamics partner “Dynamics Square“. There are also native applications available for mobile devices with iOS and Android systems.
Power BI Service Evolution
Evolution of Power BI The BI (Business Intelligence) world has been working for years on the Self Service BI concept, which aims to provide the business analyst with tools with which not only to generate their own business model, but also exploit reportability using a variety of data sources (online and on premises), as well as visualizations with high impact for the user. Microsoft also began to work on several add-ins that Excel provided to incorporate BI tools that allowed, initially, to develop a data model but also adding value to the business by generating calculated columns, measures and KPI’s.
On the other hand, it was complemented with PowerView, a tool that allows adding a dynamic graphic style by connecting to the data model and obtaining information in a practical, agile way and with great visual impact for the end user.
With Power Map, as an Excel complement, we sought to add layers that would allow data visualization in a specific geographical environment. Regarding Power Query, as a complement, Web queries were added to incorporate information into the data model.
The tool is none other than the evolution of an instrument whose purpose is to execute the complete analysis life cycle.
Practical cases
With the focus on different projects with verticals in the world of Finance, Forestry and Energy, Dashboards can be developed that allow clients to have an overview based on key parameters of their business (measures, KPI’s, indicators at a macro level). From said Dashboard they have the possibility of receiving alerts in the event of changes, sharing said information with colleagues in their organization, making them available on mobile devices (iOS, Android, Windows) and making comments on business questions that may arise.
Data Sources
With this slogan, the suite allows us to have a pool of different links to data sources such as those that can be seen in the following image.
These data sources are being updated in a timely manner in the tool and with changes that are being incorporated weekly by Microsoft.
Access to data On Premises – Gateway
Power BI Gateway acts as a bridge that enables data transfer between Power BI on-premises and service data sources that support data refresh from On Premises servers.
The Gateway is installed and runs as a service on your computer. As a service, it runs under the Windows account that you specify during setup. In some cases, the gateway runs as an application.
When Power BI updates data from an on-premises data source, the gateway ensures that the Power BI account has the appropriate permissions to connect to and query the data from the source.
Data transfer between Power BI and the gateway is secured by the Azure service. The service bus creates a secure channel between the Power BI service and your computer. Since the gateway provides this secure connection, it is not normally necessary to open a port in the firewall.
According to the previous image, we can visualize a connection generated against an On Premises environment to extract information from an SSAS (Analysis Services) cube to generate Dashboards and Reports. Once the configuration is done and the connection is established, either in the web version or in the desktop tool, it can be used to generate reports as shown in the following image:
Conclusions The world of business analysis is booming and Microsoft presents us with a suite of tools to universalize the concept of Self Service and that the exploitation of data remains in the hands of analysts, who will not only find a simple and fast way to exploit the information but also in the construction of a robust data model. You can contact Microsoft Dynamics Partner Dynamics Square and directly contact us +44 207 193 2502 for UK User And +1 213 784 0845 USA User.


